By Tyler Williams, Extension Educator
One of the most difficult tasks of renting ag land is determining a “fair” price for all parties involved, and the current economic challenges make that task even harder. The University of Nebraska–Lincoln Agricultural Economics Department conducts a yearly survey to help landowners know and understand the value and average rental rates of the land in their area.
ABOUT THE SURVEY
On March 18, 2018, the “2018 Trends in Nebraska Farmland Values and Rental Rates” report was released from Cornhusker Economics http://agecon.unl.edu/cornhuskereconomics and this article contains “preliminary” data from the 2018 Nebraska Farm Real Estate Market Survey. This survey was sent to professional farm and ranch managers, certified general appraisers and agricultural bankers earlier this winter asking about prices and values for the upcoming 2018 growing season.
This report is considered “preliminary” because it is publicized once enough surveys are returned in order to have statistical significance. This allows users to see most of the data as early as possible to assist with rental rate negotiations, with the understanding the numbers may be a little different in the final report to be released in June. This March report is simply a “sneak-peak” to the final report and should be used as such.
REPORT FINDINGS
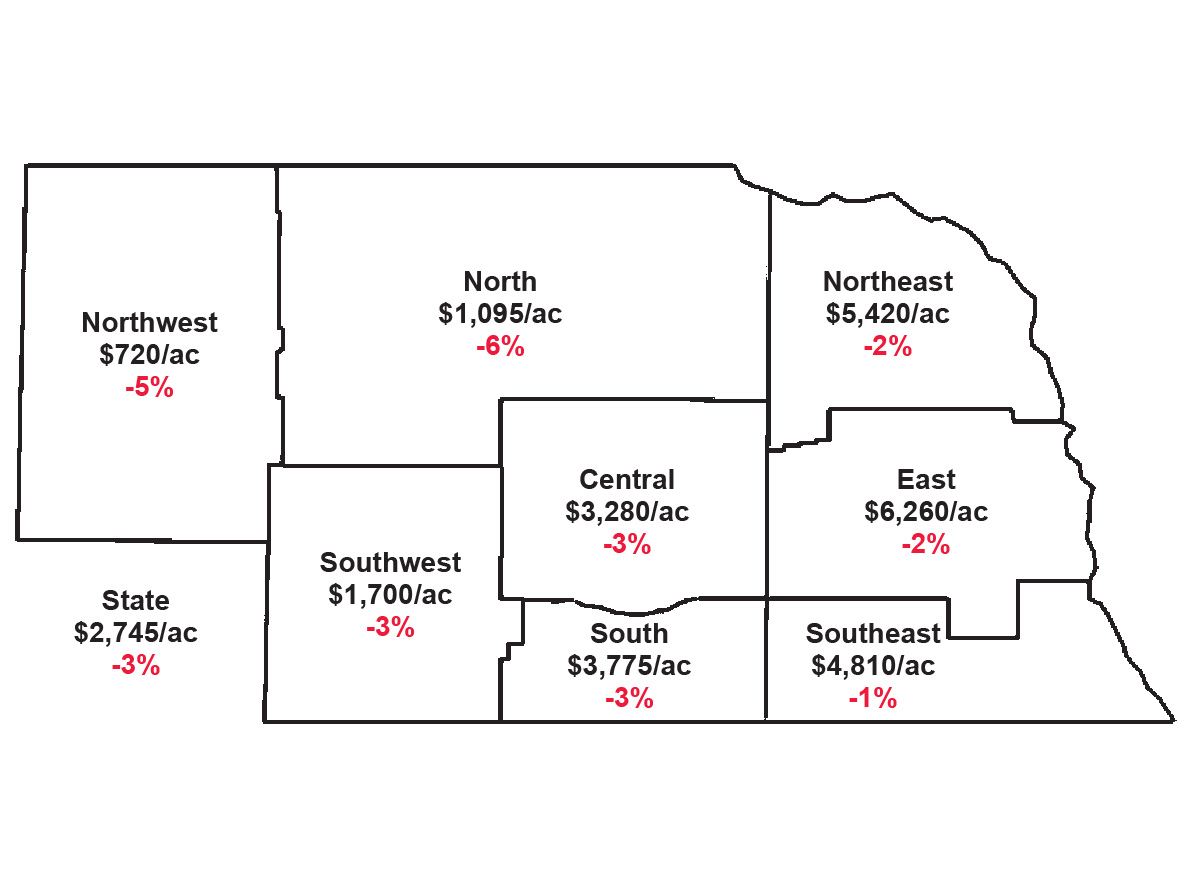
The report provides data based on the eight Agricultural Statistics Districts in Nebraska (see map above). Lancaster County is located in the East District; however, much of the agricultural land will have similarities to the Southeast District. There are two data sets provided: Average Value of Farmland and Reported Cash Rental Rates. The Farmland Values in Table 1 (https://agecon.unl.edu/cornhusker-economics/2018/farm-real-estate-preliminary-results#table1) is split into Dryland Cropland (with or without irrigation potential), Grazing Land (tillable or non-tillable), Hayland and Irrigated Cropland (with gravity or center pivot). The table also shows the percent change from 2018 and it is not surprising that nearly all locations saw a decrease in land values. Overall, the All Land Average in the East and Southeast Districts decreased by two percent and one percent, respectively; however, grazing land decreased the most in the East and gravity irrigated cropland decreased the most in the Southeast.
The most popular data from the survey is the Reported Cash Rental Rates found in Table 2 (https://agecon.unl.edu/cornhusker-economics/2018/farm-real-estate-preliminary-results#table2). This table provides cash rent data on dryland cropland, gravity and center-pivot irrigated cropland, pasture and cow-calf pair rates. The overall cash rental rates have primarily decreased as well, when compared to 2017. This was the third year in a row for decreases in rental rates, except for dryland cropland in the Southeast district. The East and Southeast districts had the largest decrease in pasture rental rates after another year of significant decreases in livestock and feed prices.
When using this data, it is very important to remember the report produces values for a region and doesn’t take into account the local “supply vs. demand” that may alter these values for your land. The report also provides a range based on the quality of the ground, which can be highly subjective.
Communication with your tenant or landlord is critical for understanding the needs of both parties as this report does not include the multitude of factors unique to your farm. These numbers should simply serve as a starting point for the communication on rental rates.