Excel 2013 has a new feature, Quick Analysis, which allows the user to quickly and easily analyze data through some preset options.
Use the data shown in the picture for the example.
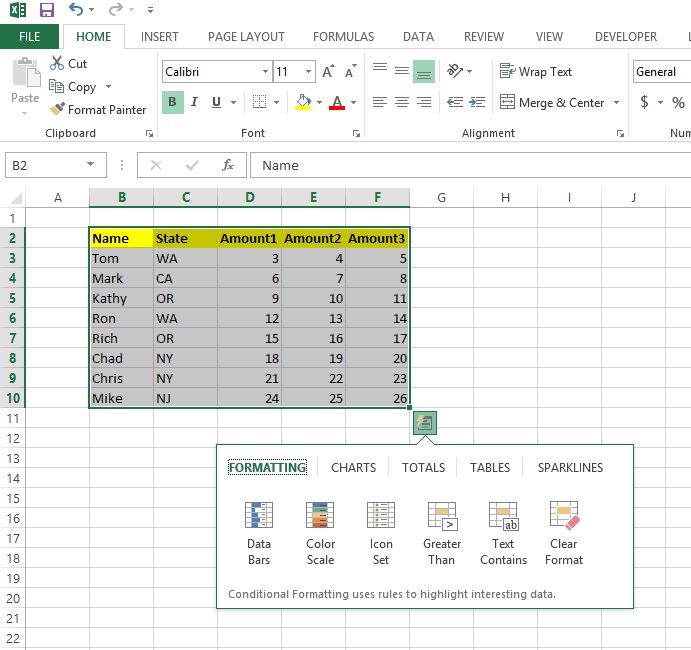
1. Select the whole table.
2. At the bottom right of the selection, a "Quick Analysis" button will appear.
3. Click the "Quick Analysis" button and options for formatting, charts, totals, tables and sparklines will appear.
4. Choose the category, hold the mouse over the options to see samples of what is produced. Then click on the desired choice.
This file, along with illustrations can also be found in SharePoint > Software Users Group > Shared Documents > Excel > Quick Analysis with Excel.
Excel Fun Fact: The first version of Excel was released in 1985.