Archived Story: This article is part of our newsletter archives. It has
been preserved for reference, but the information may no longer be current.
Google Analytics reports can provide an overview of key metrics to help you measure your website's performance. Having a measurement plan helps answer questions like what is the goal of my website? Are there things I can do to improve its performance? Are there any technical issues with my website? Is the information on my website easily understood by users? Does it follow best practices?
Analytics measurement plan:
- Set goals for your website
- Develop a strategy to reach your goals
- Determine the key performance indicators (KPI)
- Review analytics reports
- Determine internal and external benchmarks
- Evaluate the success of your plan, make changes and test your changes
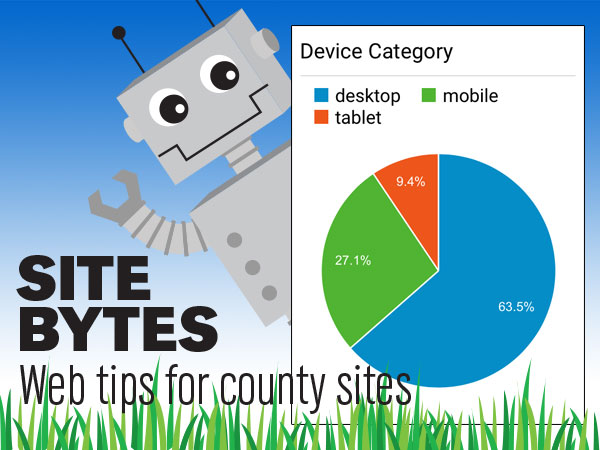
Your county website’s Google Analytics account includes default dashboard reports that can be periodically emailed to county website managers and team leaders. Dashboard reports display graphs and data for your top website traffic. For example, you can view a pie graph illustrating which web browsers are used the most. You can also view a list of which websites send your website the most traffic and which pages on your website receive the most traffic.
A dashboard report is just one of many Google Analytics reports that can be generated. Having a measurement plan will help you determine which reports are the most useful.
Common Google Analytics reports:
- Dashboard Traffic Overview
- Audience Overview
- Downloads
- All Pages
- Referral Landing Pages
How to request Google Analytics reports:
To request Google Analytics reports for your county's website, click the link below and complete the form (you will need to be logged in with your UNL login to view the form page).
https://ianrmedia.unl.edu/request-google-analytics-report
###
Site Bytes is a regular column in Nebraska Extension – Keeping Up that provides quick tips for enhancing your county website. Written by Anne Holz, IANR Media web strategist.