Archived Story: This article is part of our newsletter archives. It has
been preserved for reference, but the information may no longer be current.
There are instances in which you may have a small amount of data in a table in Word that you would also like to have displayed in a graph. This can be done within Word rather than employing Excel.
1. In a Word file, create your data set.
2. Select the data to be included in the graph.
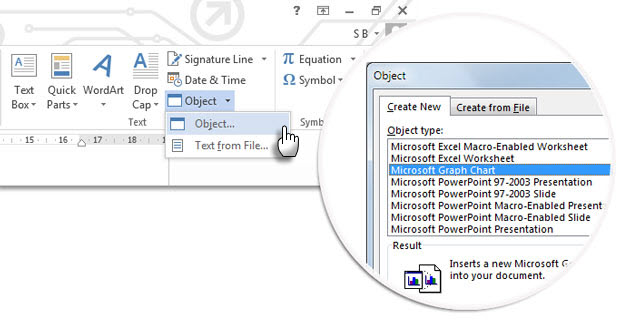
3. Click on the "Insert" tab on the Ribbon. Click on the "Object" tool within the "Text" group and select "Object."
4. From the "Object Type" list choose "Microsoft Graph Chart" and choose "OK."
5. The chart appears and you can do adjust the settings and options to determine the best format for your needs.
This information can also be found at SharePoint > Software Users Groups > Word > Converting a Tabular Table to a Graph in Word.docx.