North is at the top of the map, and northern states are at the top of this year's U.S. State Entrepreneurship Index from UNL.
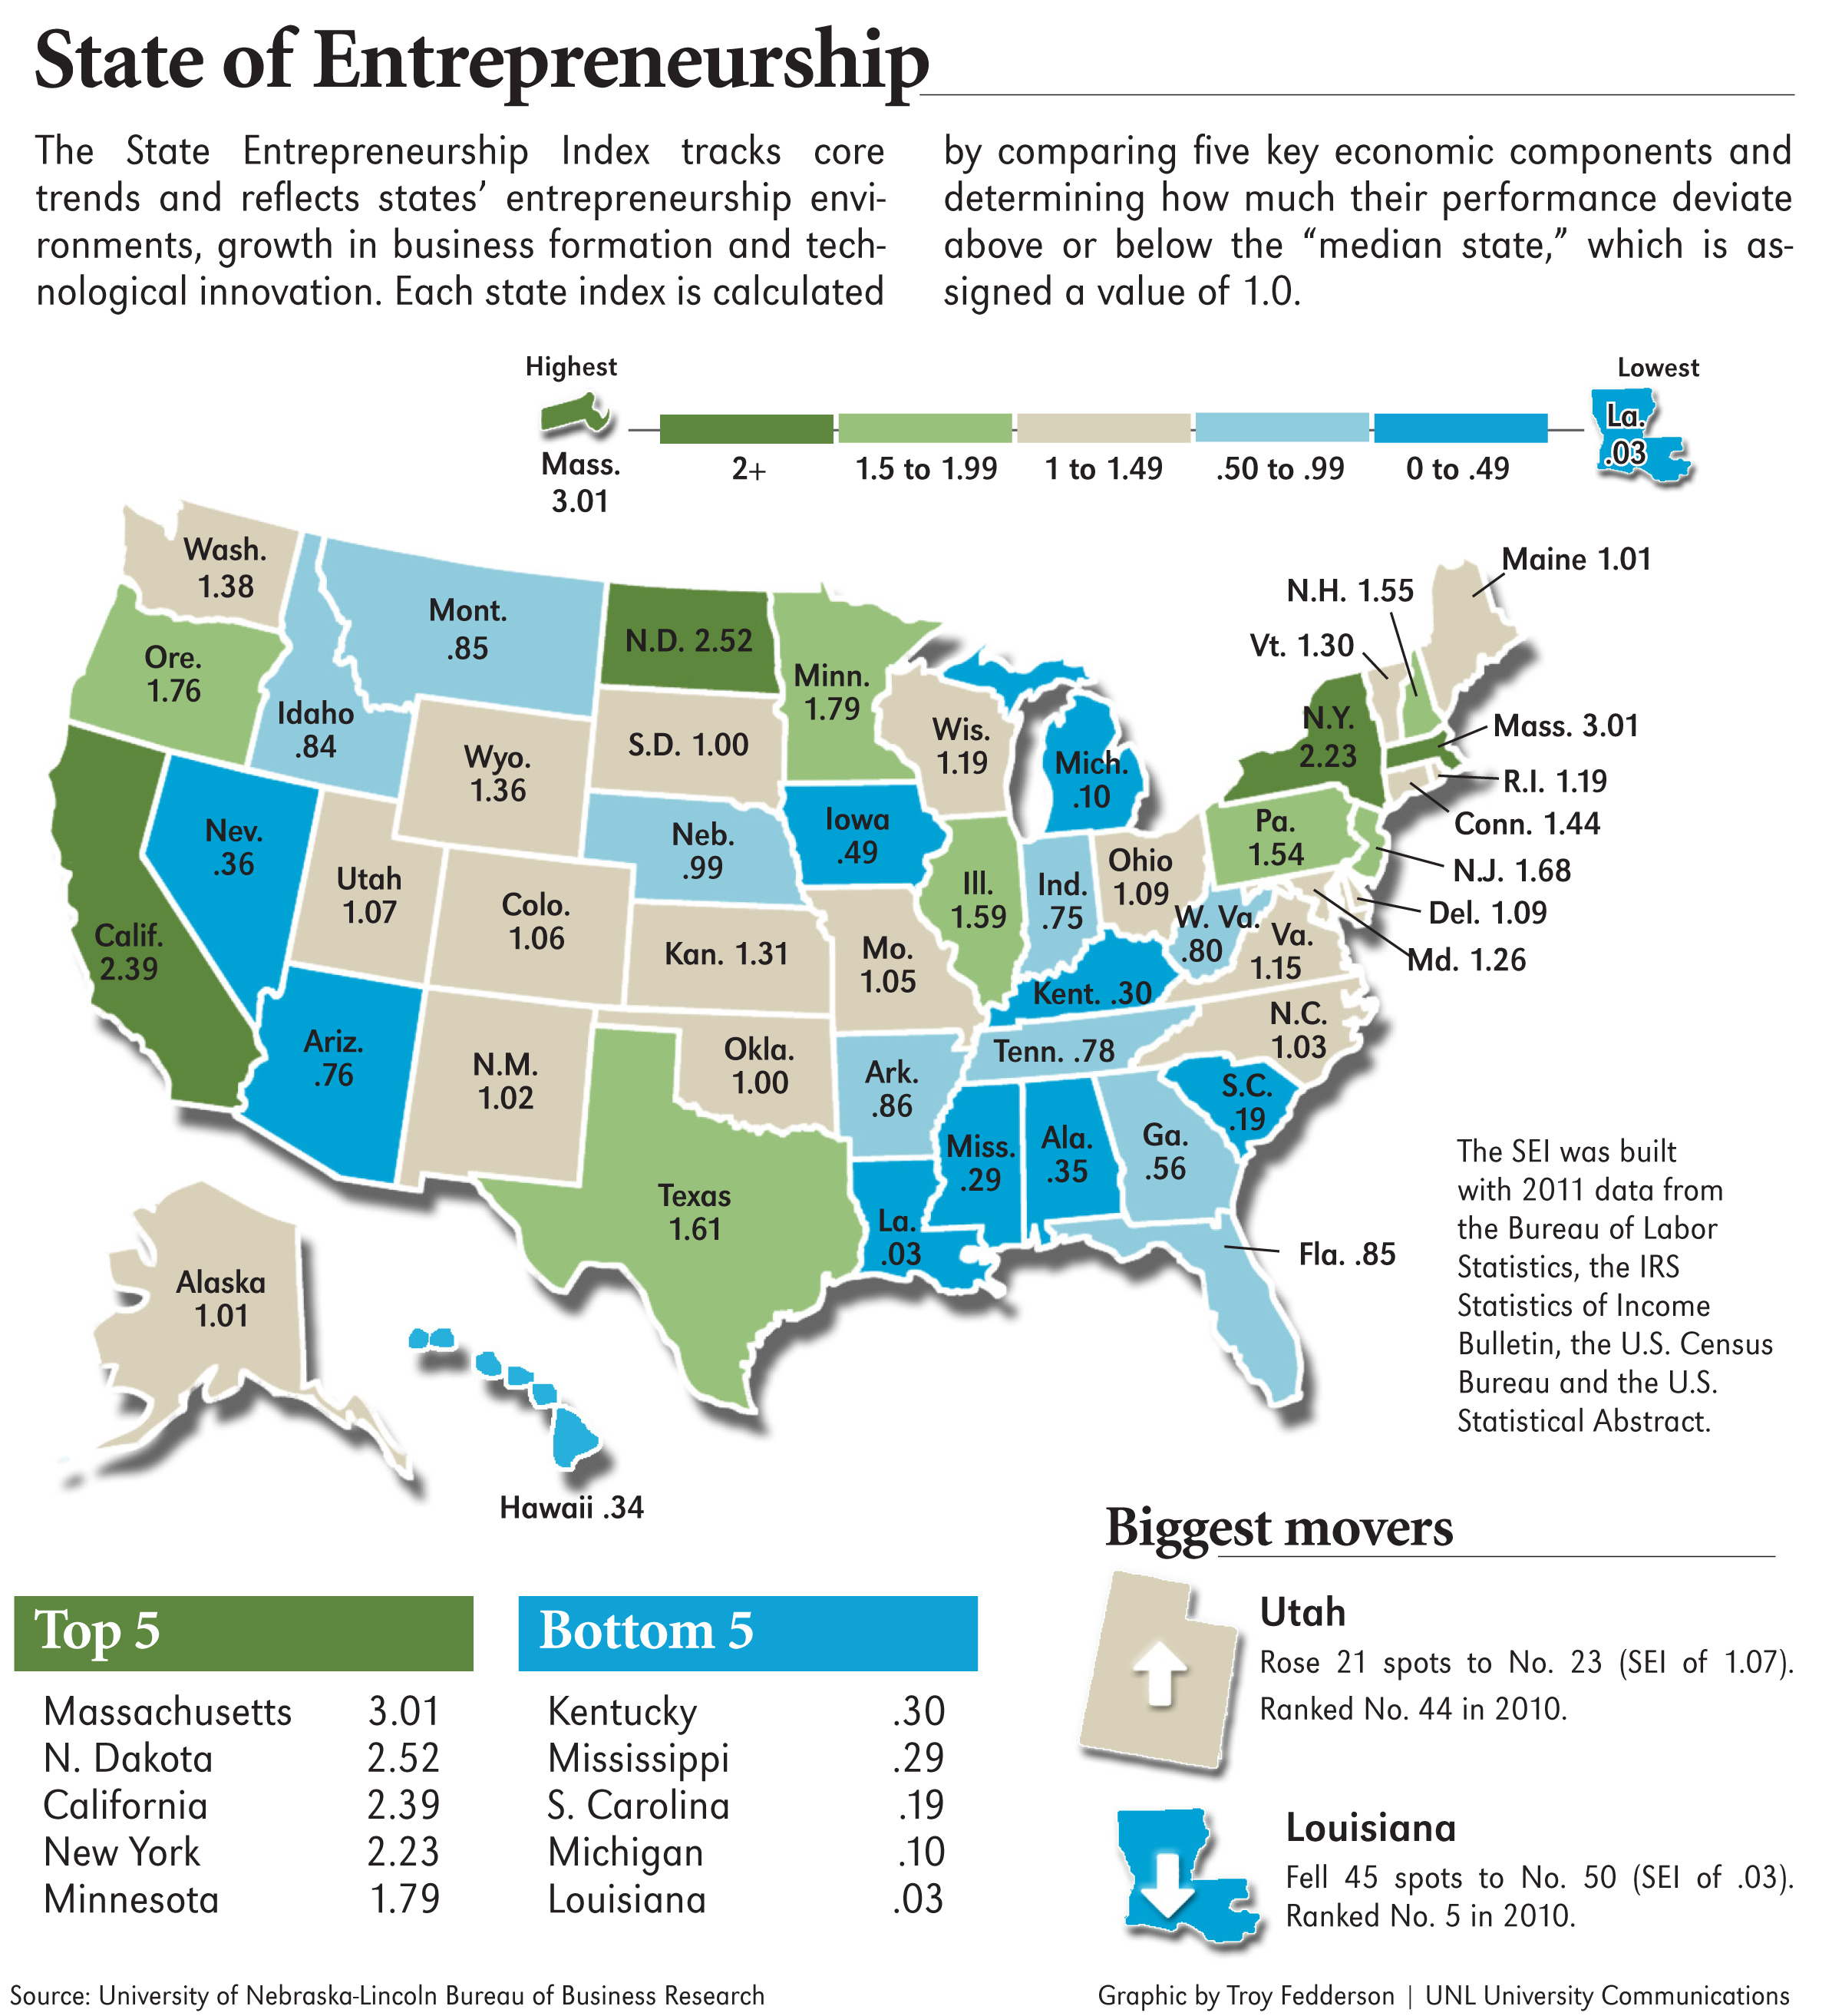
Massachusetts is No. 1 in the SEI, an annual state-by-state measurement of entrepreneurial activity of all 50 states. The Bay State was followed by North Dakota, California, New York and Minnesota. Also in the Top 10 this year were Oregon, New Jersey, New Hampshire and Illinois. Texas, at No. 8, was the highest ranked southern state.
Economists at UNL's Bureau of Business Research and Department of Economics developed the annual State Entrepreneurship Index by combining five key components — a state's percentage growth and per capita growth of business establishments, its business formation rate, the number of patents per thousand residents and income per non-farm proprietor in each state.
The result is a comprehensive look at the levels of entrepreneurship in each state over the past year, said Eric Thompson, UNL associate professor of economics and director of the bureau.
"To reach the top of the rankings, a state had to do very well in at least four of the five categories that made up the index," Thompson said. "This year, those states tend to be clustered in the Northeast and the upper Midwest. That's not to say there is not significant action in other regions of the country, of course, but our data shows this year's entrepreneurial activity has a definite northern flavor."
A state index for each component is assigned based on how much each state's performance is above or below the median of all state data, which has a value of 1.0. For example, a component one standard deviation above the median gets a value of 2.0, while a component one below is assigned a value of zero. A state's overall SEI number is the average of the five index values.
For 2011, the latest year for data, Massachusetts' score was 3.01, thanks to its vigor in four of the five components, including both measures of establishment growth, patent activity and income per proprietor. North Dakota (2.52), California (2.39), New York (2.23) and Minnesota (1.79) completed the top five. Minnesota advanced 18 spots from No. 24 last year on the strength of improved establishment growth and a strong business formation rate, the report showed.
North Dakota, which was ranked No. 8 last year, jumped to No. 2 thanks mainly to high rates of business formation and establishment growth. Texas (1.61) had a strong establishment growth rate and a high value for income per non-farm proprietor.
Utah was the biggest climber in the rankings, moving from No. 44 last year to No. 21 in the current list. Ohio, No. 40 last year, moved up to No. 22, while Arizona, Maine, Maryland, North Carolina and Wisconsin also posted double-digit improvements.
Nebraska (0.99), the home of the SEI, slipped seven spots from its prior ranking to No. 32.
Weighed down by sharp declines in number of establishments, Louisiana was No. 50 with an index score of 0.03 and Michigan (0.10) was No. 49. However, there were positive signs for both states — Louisiana exhibited an above-median value for income per non-farm proprietor and Michigan had an above-median value for patents per thousand residents.
South Carolina (0.19) was No. 48, behind Mississippi (0.29), Kentucky (0.30) and Hawaii (0.34). Louisiana, which ranked No. 5 last year, highlighted a handful of states that experienced steep drops in the current rankings. The Pelican State's 45-spot slide led seven states that fell at least 10 spots from last year. The others were Alaska, Idaho, Kentucky, Oklahoma, South Dakota and Washington.
The State Entrepreneurship Index combines detailed data from the Bureau of Labor Statistics, the IRS Statistics of Income Bulletin, the U.S. Census Bureau and the U.S. Statistical Abstract.
The year-over-year changes reflect states' movement from last year's final SEI rankings. In the current report, last year's rankings were adjusted after final data in all five components was obtained and due to a new data source for one of the indicators, income per non-farm proprietor. Some states’ positions in last year’s SEI, which used preliminary figures to calculate a portion of its components, changed when final numbers were updated.
The report, which breaks down each state's individual index components in tabular form, is available at the bureau's website, http://bbr.unl.edu.
— Steve Smith, University Communications