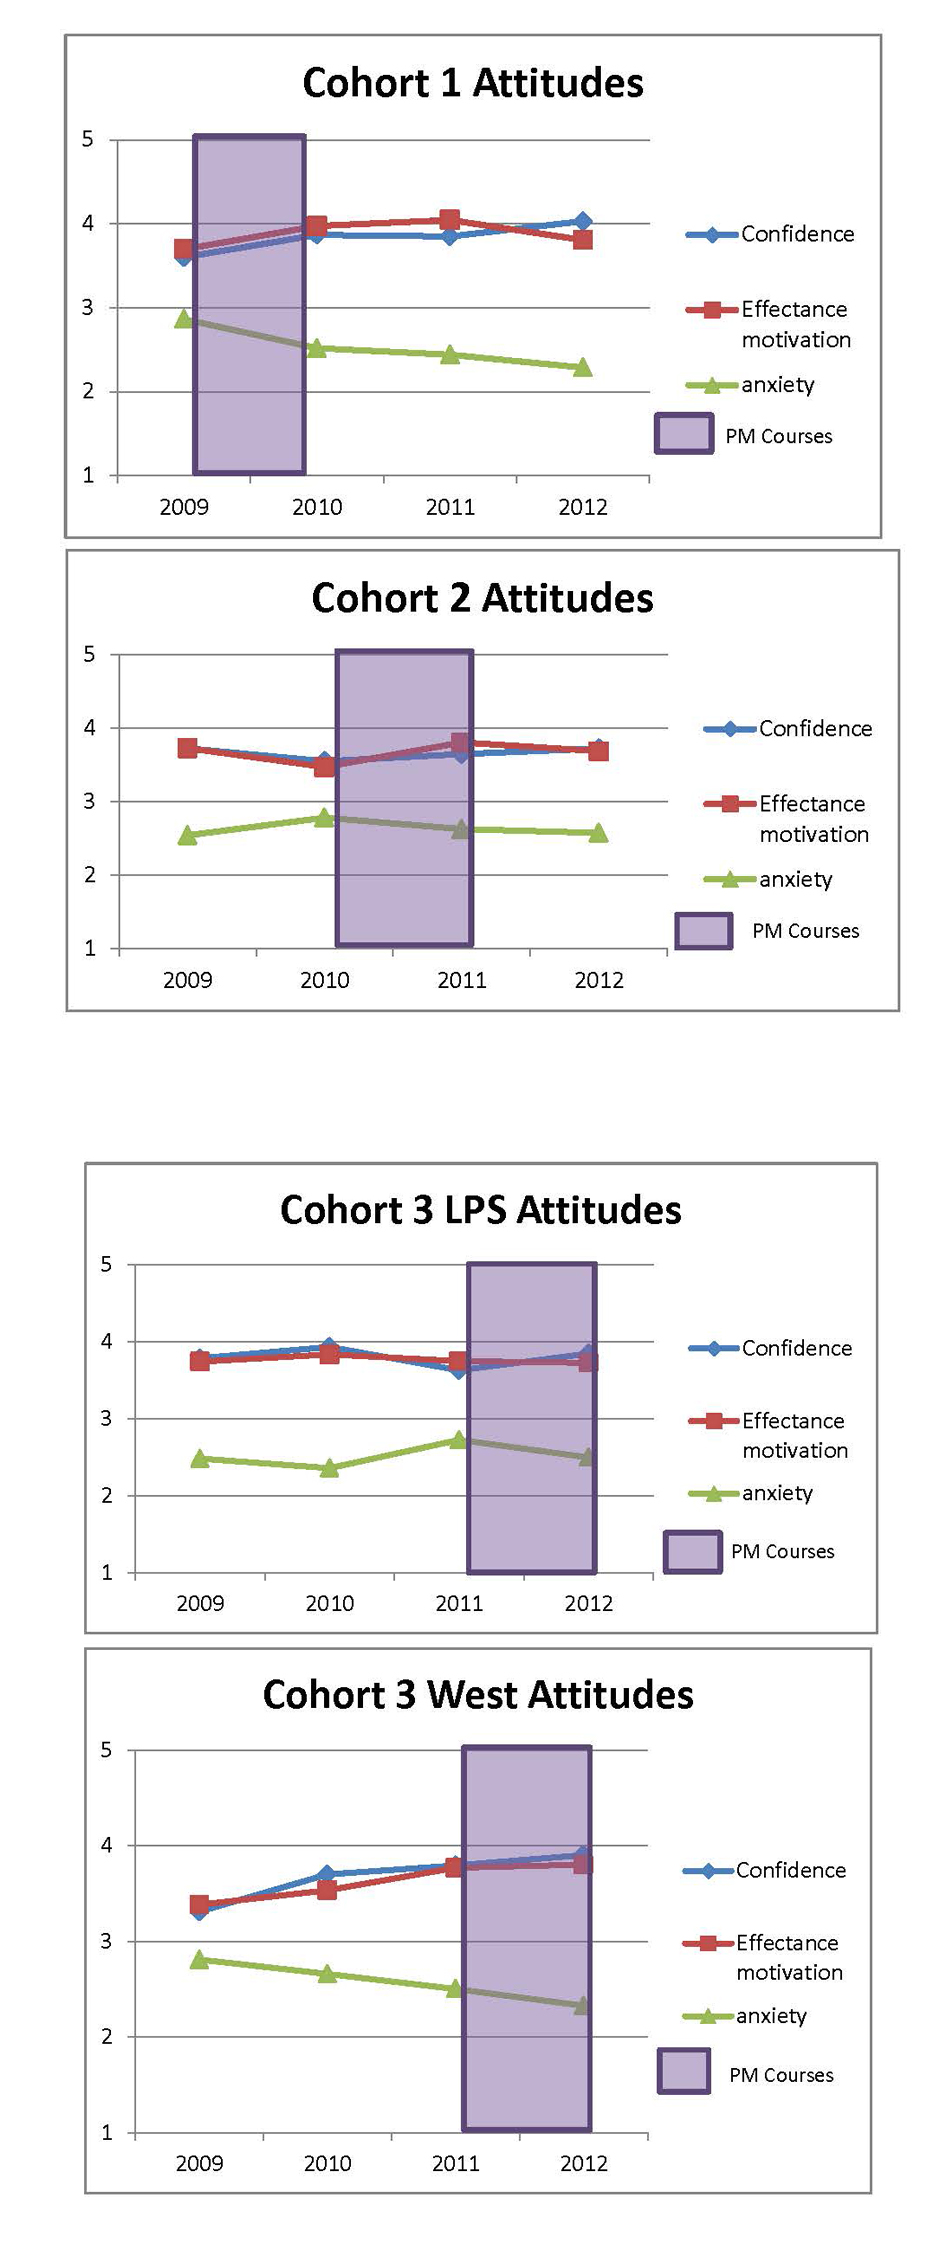
Among the surveys completed by Primarily Math participants is one titled the "Mathematics Attitude Inventory." This survey is designed to measure changes in three attributes: teacher confidence, motivation (called "effectance" motivation in the graphs), and anxiety towards the learning of mathematics.
You may recall responding to survey items designed to evaluate these characteristics such as
- I have a lot of self-confidence when it comes to math.
- Mathematics is enjoyable and stimulating to me.
- Mathematics makes me feel uncomfortable, restless, irritable or impatient.
Results from the surveys completed by teachers in Cohorts 1-3 are displayed in the tables shown. Summaries of the results are as follows.
COHORT 1:
For Cohort 1 (16 LPS teachers, 2 PLV teachers, 17 teachers from smaller districts), there was a significant decrease in teachers’ anxiety and a significant increases effectance motivation, and confidence from 2009 to 2010. The changes of teachers’ confidence and anxiety were retained from 2010 to 2012 (which means no significant difference between 2010 and 2011, and between 2011 and 2012). Teachers’ effectance motivation showed no significance difference between 2010 and 2011, however, significantly decreased between 2011 and 2012. With this decrease, however, teachers’ effectance motivation was still higher then it was in 2009.
COHORT 2:
For Cohort 2 (8 PLV teachers, 16 OPS teachers, 6 other teachers), there was a significant decrease in confidence, effectance motivation and anxiety between 2009 and 2010. There was a significant increase in teachers’ effectance motivation from 2010 to 2011, whereas there was no significant difference in confidence and anxiety. The changes were retained from 2011 to 2012.
COHORT 3 - LINCOLN
For Cohort 3 Lincoln (34 LPS teachers), teachers’ confidence, effectance motivation, and anxiety did not change across the four years (from 2009 to 2012). Note more teachers were recruited in 2011, which could skew changes we see as we double (or more than double) the participants in our sample (due to them starting at different times).
COHORT 3 - West
For Cohort 3 West (31 rural teachers), teachers’ confidence, effectance motivation, and anxiety did not change across the four years (from 2009 to 2012). Note more teachers were recruited in 2011, which could skew changes we see as we double (or more than double) the participants in our sample (due to them starting at different times).
COHORT 4 (Lincoln, PLVPS, OPS)
Cohort 4 OPS (32 teachers, including 23 OPS), ESU-3 (40 including 20 PLSD), and LPS (33 LPS plus one rural) teachers were recruited in 2012, so began taking the survey in spring 2012. Comparison data have not yet been collected.
Watch for more survey results in the next issue of Primarily Math News.