The MKT assessment measures K-6 teachers’ knowledge of mathematics as it relates to teaching elementary math within three subscales: Numbers and Operations; Patterns, Function, and Algebra; and Geometry. The items include questions about teaching knowledge, such as choosing the best examples or representations to illustrate specific mathematical ideas, and items that ask teachers to interpret examples of student thinking. Scores on the MKT are reported as standardized scores, with a mean of 0 and standard deviation of 1 as compared with a large national sample of K-6 teachers. Thus, 50 percent would have a negative score and 68 percent of all K-6 teachers in the U.S. would score between -1 and 1.
While the national sample for the MKT is K-6 teachers, the MKT creators have data showing K-3 teachers are expected to have lower scores than the overall scores for the K-6 population. Since Primarily Math participants are K-3 teachers, it is reasonable to expect them to score below the mean prior to beginning Primarily Math. This is what happened for teachers prior to Primarily Math, as the average of all scores was -0.16 and approximately 60 percent of the scores were negative. However, after Primarily Math, the K-3 teachers’ mean score is 0.45, representing a gain of more than half of a standard deviation. While nationally only 16 percent of all K-6 teachers score above 1.0 (1 standard deviation above the mean), after Primarily Math, 23 percent of the K-3 teachers in the first three cohorts scored in that range. This means 23 percent of Primarily Math teachers outscore 84 percent of the nations K-6 teachers!
Clearly, the Primarily Math program is having a large effect on teachers’ mathematical knowledge for teaching. We are currently working on how this knowledge impacts student success in mathematics (using TEMA-3 data). We'll share these results in a future newsletter.
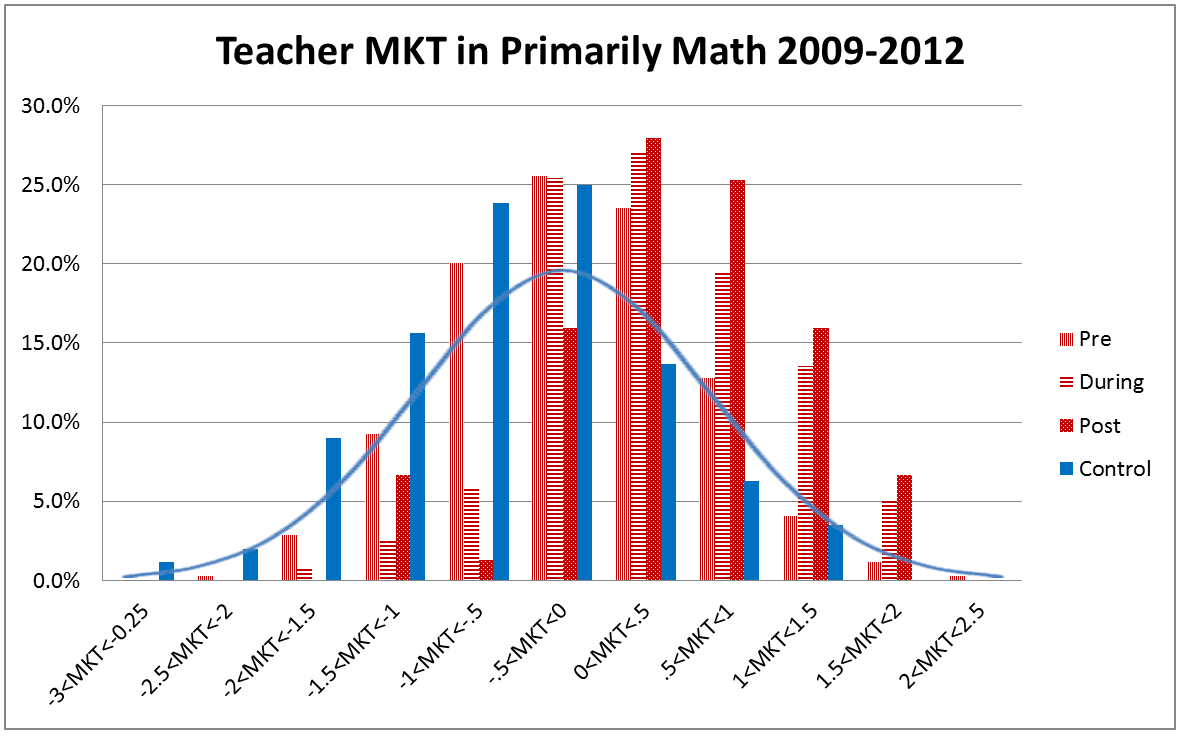
Notes about the graph: The blue line represents the expected distribution of scores for K-6 teachers on the Mathematical Knowledge for Teaching, which asks teachers to choose the best representations of specific mathematical ideas or to interpret examples of student thinking. While the control group and the pre-Primarily Math scores roughly follow this distribution (slightly lower), the during and post-Primarily Math scores exceed the national averages significantly.