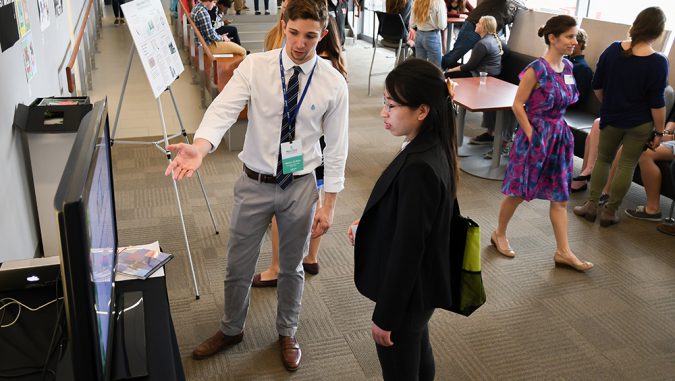
During the 2017 Water for Food Global Conference, University of Nebraska–Lincoln students filled the sunlit hallway of the Nebraska Innovation Campus Conference Center to present infographics exploring various water issues. The student work was part of SCIL109 “Water in Society,” an introductory class targeted to undergraduate students that focuses on the scientific, social and economic aspects to water systems throughout history and today. The course also encourages students to analyze and make decisions about water resource issues. They generated the infographics using Piktochart, a free online creative design platform.
Jennifer Gilbert, a freshman environmental studies major, and Sarah Fagras, a sophomore environmental studies and fisheries and wildlife double major, presented their group’s infographic, “Water Usage in the Great Plains Aquifer.” The piece focused on the importance of managing aquifers sustainably and the environmental effects of water use. It included a map of the aquifer and a visualization of the different ways water from the Great Plains Aquifer is used through the depiction of 100 water drops. Ninety-six green water drops symbolized agricultural use, two blue water drops symbolized public use, one red water drop symbolized power use, and one yellow water drop symbolized domestic and commercial use.
Gilbert said that when her group was creating the infographic, it was eye opening to visualize 96 percent of the aquifer use for agriculture. She added that she had not expected this number to be so high because most public campaigns to reduce water consumption focus on public supply rather than agriculture.
Gilbert chose to study environmental studies because she not only cares about the environment and sustainability, but she also wants to help educate the public and improve the environment for future generations.
Fagras agreed with Gilbert’s reasoning for pursuing environmental studies and added that she “…[doesn’t] like seeing people disrespect the environment.” She also loves animals, which prompted her to add fisheries and wildlife to her studies.
Lauren Uhlig, a sophomore environmental studies and fisheries and wildlife double major, explained that her group’s infographic “Des Moines Takes on Water Pollution,” focused on Iowa’s agricultural fertilizer use that has led to excessive nitrate levels in surrounding rivers. State regulations require these harmful nitrates to be filtered from the rivers to reduce water pollution. Her group’s infographic included large photographs detailing these aspects of water pollution in Iowa, as well as suggestions for ways in which farmers could help to prevent nitrate leaching by using cover crops.
For Uhlig, studying the environment is important and after college, she would like to help educate others about the environment.
“There are little things that harm the environment that are easy to prevent rather than just big things like oil spills,” she said when asked what impacts science literacy can have on the public.
Junior environmental studies major Michaela Daugherty and freshman environmental studies major Chris Sukstorf showcased their group’s infographic “Climate Change and the Effect on Natural Disasters.” The group’s goal for the infographic was to illustrate the effect of increased carbon dioxide in the atmosphere on severe weather. Their infographic included a line graph demonstrating the general increase in major hurricanes per year compared to the increase in carbon dioxide, as well as a bar graph indicating the increase in the intensity of floods and flood days as carbon dioxide levels rise.
When asked why she chose her major, Daugherty said, “I know climate change is real.” She went on to add that she hopes her environmental studies major will provide opportunities to help maintain a healthy environment and possibly work for the National Parks Service one day.
Sukstorf said he chose to study environmental studies after seeing the possibilities for renewable energy, especially wind and solar power, when he was in Germany. He hopes to work in the renewable energy field, integrating alternative types of renewable energy into society.
By creating these infographics, students actively participated in a science literacy initiative to educate the public about environmental issues in their communities, helping others make well-educated decisions regarding water usage and sustainability.
“You can get the information without having to read a book,” Sukstorf said when asked about the impact of infographics. He went on to say that the ability to synthesize information into a visual representation through an infographic is an important tool in educating people and creating a more scientifically literate public.
By Kathryn Bagniewski, a communications ambassador at the 2017 Water for Food Global Conference, April 10-12. She is a sophomore majoring in agricultural and environmental sciences communication at the University of Nebraska-Lincoln.
More details at: http://waterforfood.nebraska.edu/blog/