Nebraska Mesonet weather stations throughout the northeastern part of the state survived unharmed through last month’s historic flooding that brought billions of dollars in damages.
The network, made up of nearly 70 stations, includes about 10 located in areas most affected by flooding. Each of those were installed above floodplain levels.
The weather stations, which record weather observations every 5 minutes every day of the year, capture soil moisture data, as well as precipitation, wind speed and temperature. They recorded localized information as the bomb cyclone crossed the state.
All of that data feeds into the regional and national datasets, which painted a bigger picture of exactly what led to the massive flooding in Nebraska. You can read about that here in “Nebraska’s most challenging 60 days”, co-authored by Tyler Williams and Al Dutcher, both with the Nebraska State Climate Office at the School of Natural Resources, for university partner, CropWatch.
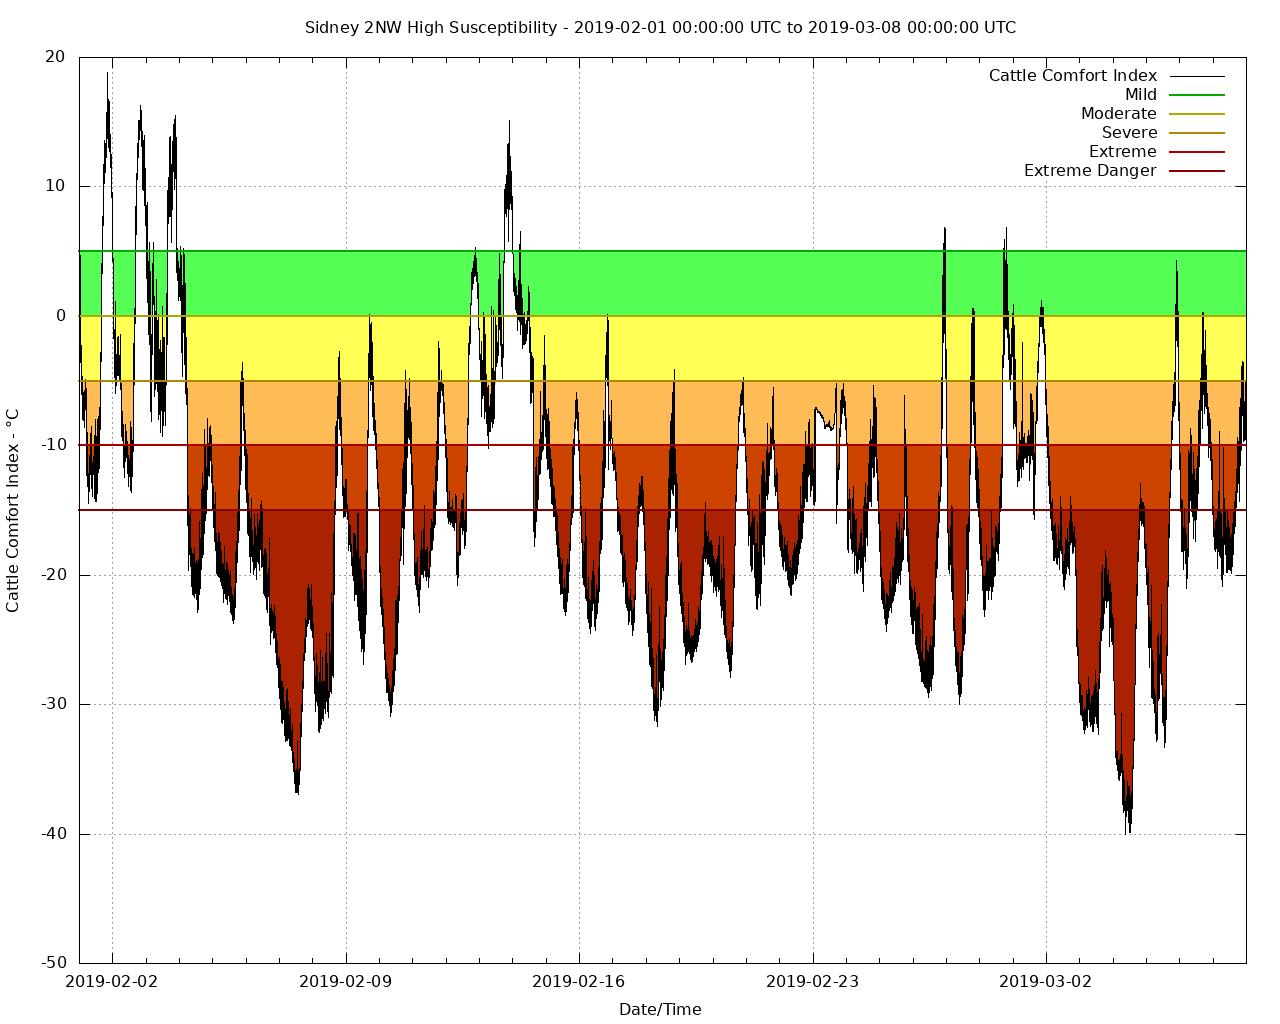
Those same observations also were used to help the U.S. Department of Agriculture respond to emergency aid requests after severe cold and wet conditions persisted through winter — and during calving season — in the many parts of the state. Data pulled by the Nebraska Mesonet was used to determine the cattle comfort index, a formula that looks at temperature, humidity, wind, precipitation and sunlight and how that affects cattle health.
“Using the cattle comfort index is not that uncommon, but is typically used during the summer for heat stress because that can have a deadly impact in just one day,” said Williams. “Using it during the cold season is relatively uncommon because most cattle — except newborn calves — can handle a day or two or a week of very cold conditions.
“This scenario was different because it was such a long period of time and many healthy cows and calves were dying. You could not feed them enough feed to give them the amount of energy they were requiring to survive.”
Leann Nelson, director of the Farm Service Agency in York, said she started getting reports of livestock losses in York and Hamilton counties in February, but the FSA Livestock Indemnity Program, which compensates producers for livestock losses in excess of normal mortality due to adverse weather conditions, listed specific weather conditions considered to be eligible loss conditions. What producers were facing didn’t seem to fit.
After reaching out to Nebraska Extension, and then other University of Nebraska-Lincoln staff, she received an email including two cattle comfort index graphs created by Stonie Cooper, Mesonet manager. They showed that for weeks, the cattle had been in severe to extreme danger due to weather conditions.
“The graphs made me realize how severe the combination of excessive moisture, extreme temperature, wind chill and lack of sunshine stressed the calves as well as the adult cattle,” she said.
So armed with the data, as well as other maps provided by Williams and UNL, the Nebraska State FSA Office informed FAS County Committees they were authorized to establish eligible adverse weather events that cause livestock deaths, providing they have the documentation.
Cattle comfort index maps created by Cooper for each Mesonet station in the state were made available for the timeframe between December and the first week of March. It is one piece the county committees are using to establish adverse weather events for the LIP.
“This tool, and the other data provide by UNL, has been extremely helpful to many of the counties in implementing the LIP program to the producers of Nebraska,” Nelson said.
More news
This story and more are in the Nebraska State Climate Office's latest quarterly report. Read about what they've been up to here.
More details at: https://nsco.unl.edu/