by Sarvani Pemmaraju, MS, MTEP Research Hub member, and Alyson E. Lischka, PhD, MTEP Research Hub leader
The driver diagram, a piece of your team report, is not just something that you should complete for data collection, but rather it should help you focus your team’s work. The driver diagram is a powerful tool that enables your community members to stay focused on the high-leverage aspects of your transformation work and is essential for achieving your collective goals as a team. As the driver diagram is revised to reflect the ongoing improvement efforts within the network, it captures the partnership's shared goals, language, theories of improvement, and future change ideas.
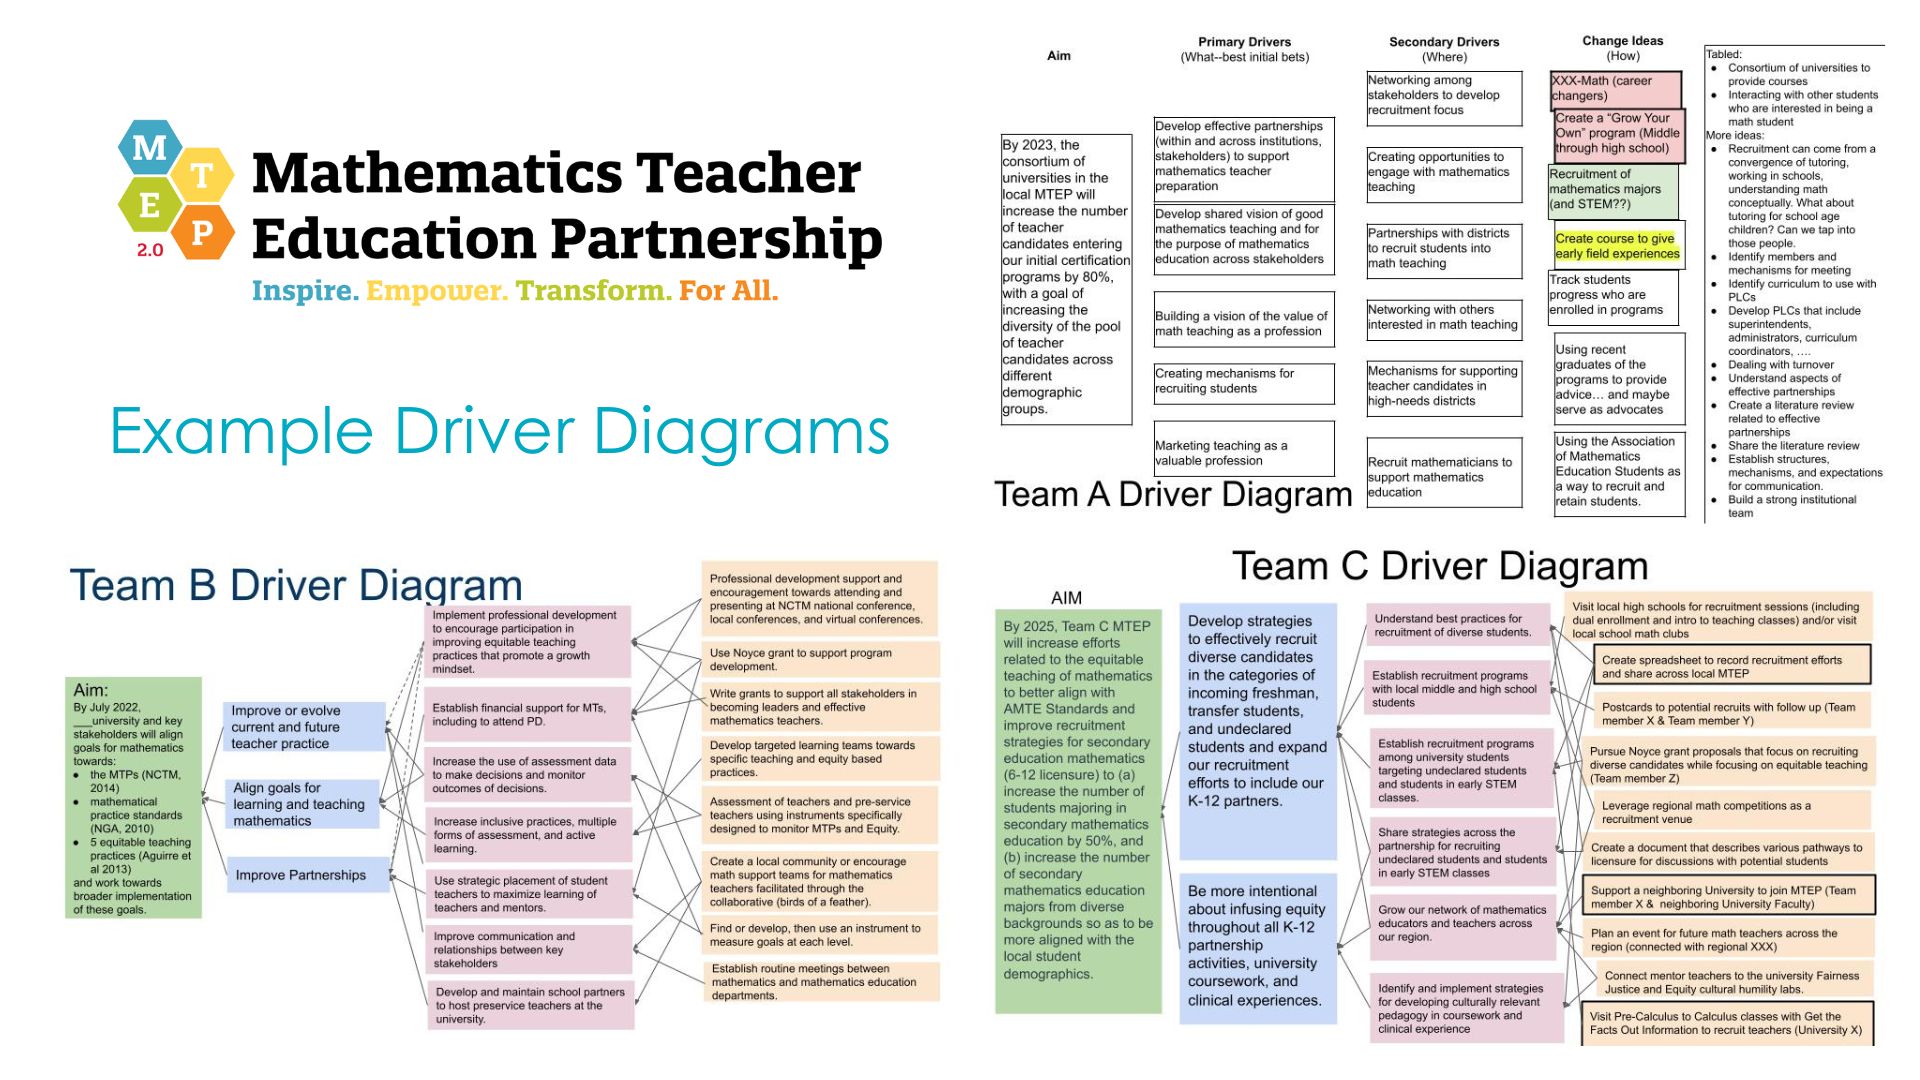
Driver diagrams can incorporate different features to help you focus on your goals and can be individualized by each team. The three driver diagrams portrayed to the right employed a variety of features to capture each team’s theory of change. (See full-size image.)
Team A labeled their primary drivers as "what," secondary drivers as "where," and change ideas as "how," thus delineating their focus. They also color-coded their areas of emphasis and included a box indicating future and tabled ideas.
Team B connected each of their change ideas back to the corresponding secondary drivers, which in turn are connected to the primary drivers. To illustrate the fact that some change ideas might be strongly connected to the primary and secondary drivers than others, Team B used solid lines for stronger connections and dashed lines for looser connections.
Team C also connected their change ideas to the drivers and added borders to the boxes of the specific change ideas that were the focus for the past year.
PDSA (Plan-Do-Study-Act) cycles complement your driverdiagrams by providing a systematic approach to implementing and refining improvement initiatives outlined in your diagram. Whereas driver diagrams help your team identify key drivers and goals, PDSA cycles offer a method for testing change ideas, gathering data, and making iterative adjustments based on real-time feedback. Essentially, PDSA cycles help operationalize the drivers and aims outlined in your driver diagram, ensuring that improvement efforts are evidence-informed and purposeful. Together, driver diagrams and PDSA cycles form a cohesive framework for focused improvement.
How is your team using your driver diagram and the accompanying PDSA cycles? Are your driver diagram and PDSA cycles aligned? Do you discuss them or revisit them on a regular basis? These tools of improvement science can support your transformation efforts in a variety of ways. If you need help using these tools, attend the Improvement Science Boot Camp in June or talk to your change coach.