Archived Story: This article is part of our newsletter archives. It has
been preserved for reference, but the information may no longer be current.
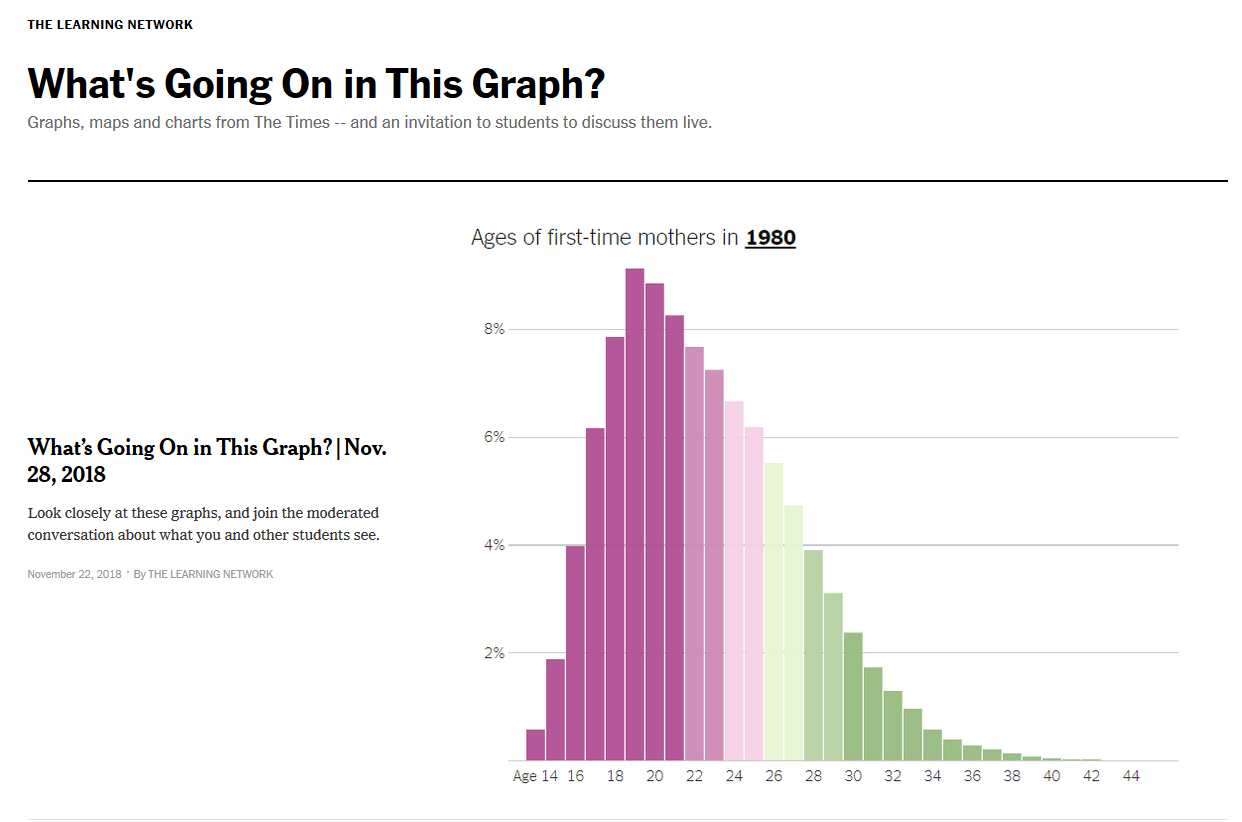
What’s Going On in This Graph (WGOITG; https://www.nytimes.com/column/whats-going-on-in-this-graph), an activity for grades 7-12 with the New York Times Learning Network that started last year, is going on weekly. “What’s Going on in This Graph?” features a data visualization from The New York Times stripped of contextual information. Then, it’s up to students to use their critical thinking skills and ask questions to deduce what the graph represents. Encourage students you know to participate in the discussion on The New York Times Learning Network website or with the tag #NYTGraphChat.