Since 2009 over 5000 K-3 students from Papillion/La Vista, Omaha and Lincoln Public schools have been assessed using the TEMA-3 test. The Test of Early Mathematics Ability, 3rd Edition (TEMA-3) calculates a standardized score called the Math Ability Score, which is an indicator of a child’s overall mathematical ability. This score is calculated through a combination of raw scores and age. The test has a mean of 100 and a standard deviation of 15, making “average” scores range from 85 to 115.
The TEMA-3 has been administered to students in classrooms of teachers who have participated in Primarily Math, as well as in comparison classrooms with teachers who did not participate in Primarily Math. (It has also been administered in classrooms of teachers in buildings where there is a coach who has been trained by Primarily Math.) In each case, these assessments take place once in the fall and once in the spring.
Because age is included in the resulting score, a child making normal or average progress throughout the year would have the same score in the fall as they would in the spring. This means that increases in scores show students who are making greater gains than the national norm for their age group. What Primarily Math researchers want to know is whether the students of teachers in Primarily Math show greater increases in TEMA-3 scores than do students of teachers who have not participated in Primarily Math.
So what have we learned?
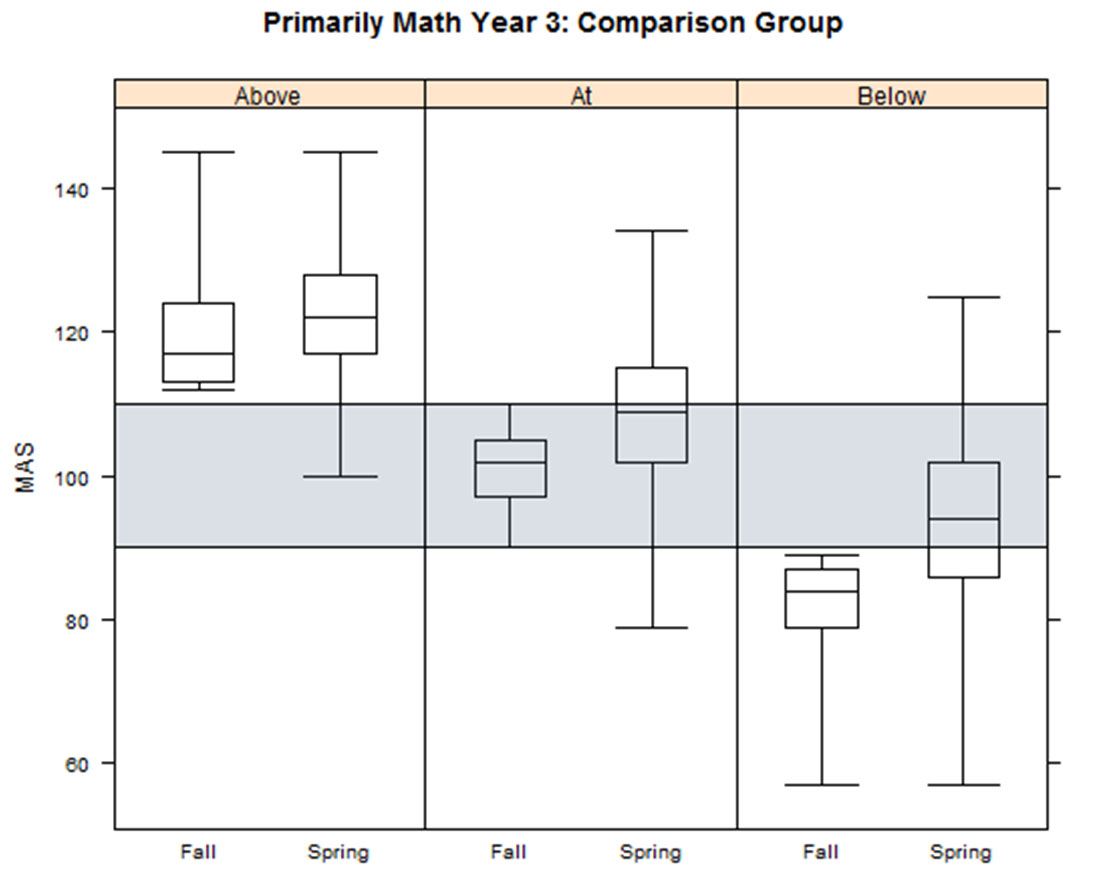
The graphs show box and whisker plots that compare the amount of increase in TEMA-3 scores between students in the comparison group and students with teachers in Primarily Math. Box and whisker plots create a visual display of the range of data, the mean and the quartiles. The graphs describing the TEMA-3 results are separated in order to easily compare three categories of students: above average, average and below average.
We are very pleased that in the three districts involved in TEMA-3 testing the data show statistically significant growth from fall to spring each school year. Furthermore, we also see positive trends in differences between classrooms with a Primarily Math teacher (average growth 11.2 points from fall to spring), classrooms in a building with a math coach (average growth 9 points), and control group classrooms (average growth 7.5 points).
Something that is especially encouraging is that the largest improvements in TEMA scores are seen in students who start the year scoring in the below-average range. Notice the graph indicates that with the benefit of receiving instruction from a Primarily Math teacher, well over 50% of these students who start a school year in the “below average” category are in the average or above average category by the end of the year.
It’s exciting to know just how much you, as a Primarily Math teacher, can make a difference.