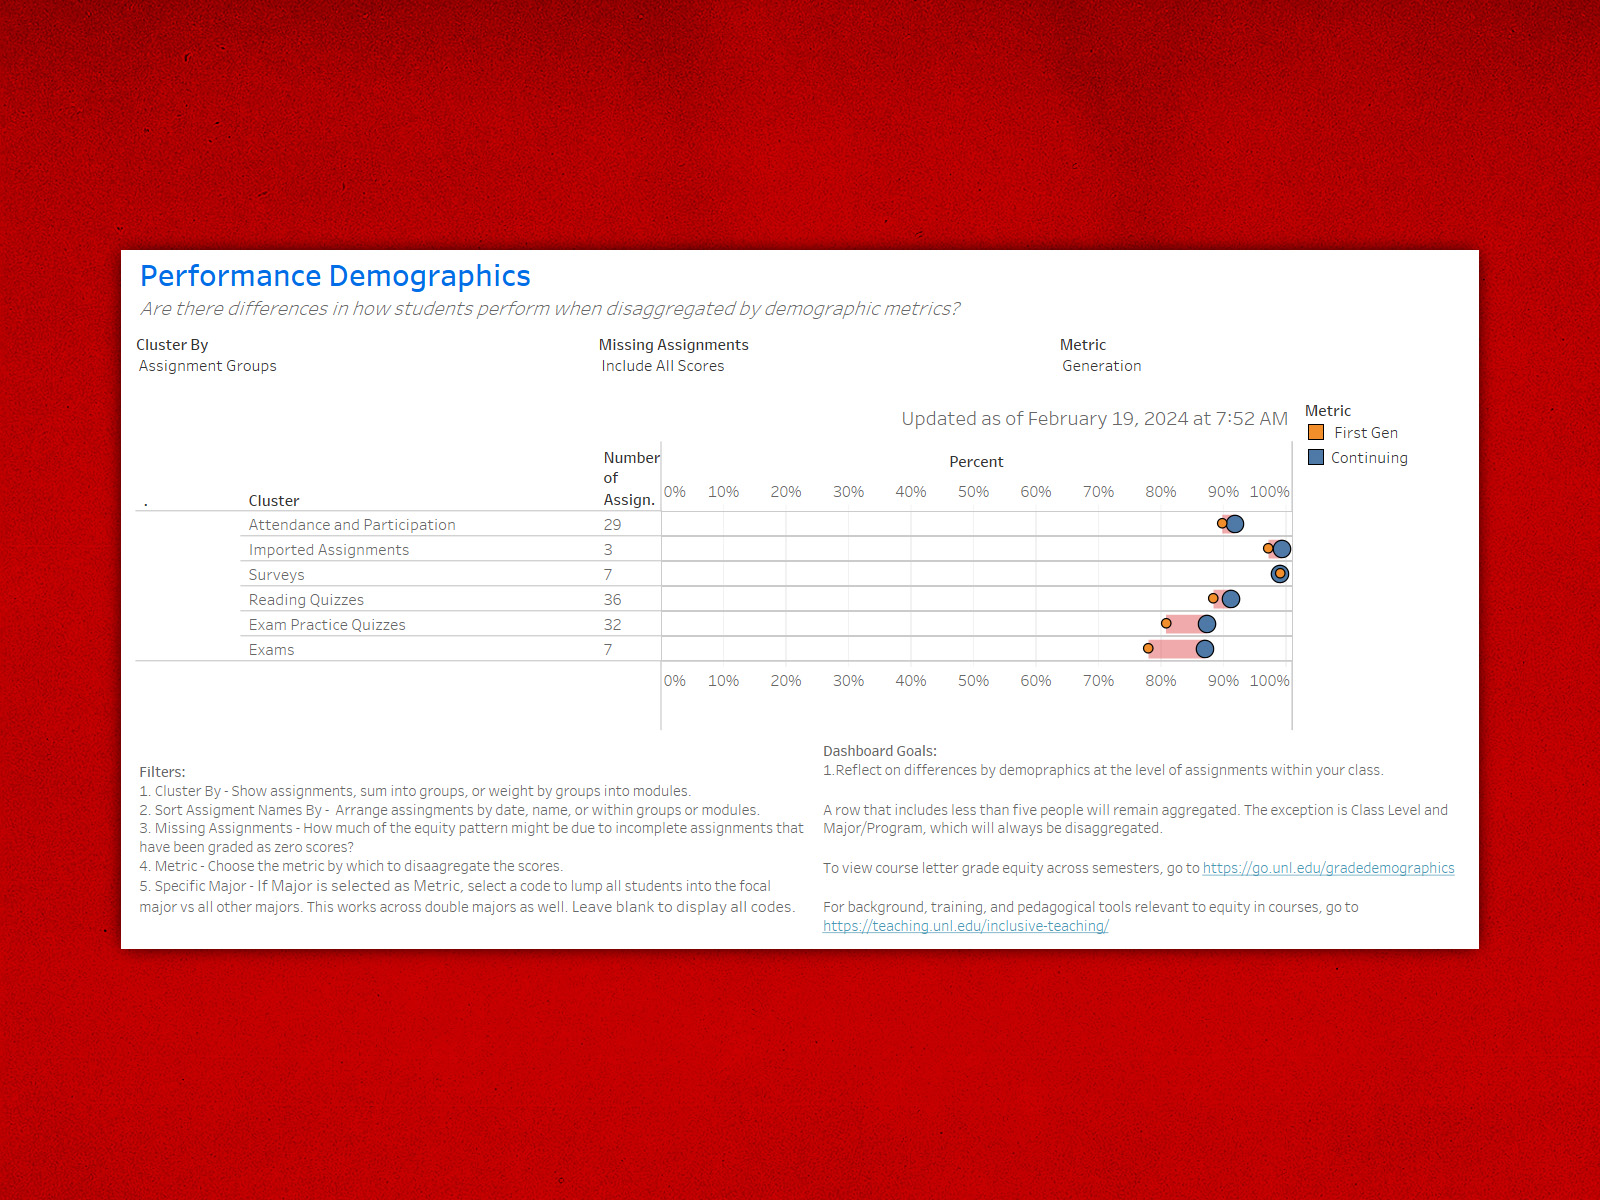
When Chad Brassil, associate professor in the School of Biological Sciences and faculty director for undergraduate analytics, examined a past offering of LIFE 121 with known course-grade demographic differences, he expected differences between first-generation and continuing-generation students to arise either during the exam or during quizzes before the exam. By looking at patterns in the Performance Demographics dashboard of Course Insights, he realized that differences were originating during the first week of class during an assignment that was participation-only. Consequently, his plan for revising the course shifted towards fully engaging all students right from the start of the term.
Without a tool that disaggregates by demographic, instructors are less able to see factors that may be impacting student performance and that could be addressed in a number of ways.
Found in the left navigation of each Canvas course shell, Course Insights comprises several dashboards and is available to all instructors of record in each of their courses.
The Performance Demographics dashboard allows instructors to examine average assignment grades within Canvas disaggregated by a variety of demographic metrics. For example, an instructor could examine the average score on the first exam for first-generation students as compared to continuing-generation students. (First-generation students are those who have indicated that no parent had a four-year degree from an institution of higher learning.)
While useful for looking back on a past course, the Performance Demographics can also be used by an instructor to monitor differences in performance as they are developing instead of waiting until the end of the semester. It often takes a day for new assignment grades to sync with the back-end databases used to generate the dashboard. The “updated as of” date and time are displayed on the dashboard for context. Using the dashboard during an active semester provides a leading indicator instead of a lagging indicator. This may allow the instructor to adjust strategies during a course instead of having to wait a full course cycle to try something different.
Performance Demographics allows instructors to organize assignments in the same way that the instructor has organized it within the course. If an instructor has assignments clustered into assignment groups, they can view assignment group averages, for example all exams disaggregated by demographic. If an instructor uses modules in Canvas, they can view assignments cluster by module and see how demographic differences are developing across their course.
Many of the same demographic metrics that are viewable in Demographic Info can be used in Performance Demographics to disaggregate assignment averages. However, in order to protect the identity of students’ personal information, assignment averages are only disaggregated by a demographic metric if there are at least 5 students in each category. Otherwise, the data for that assignment is labeled as “aggregated” and only the overall average is displayed. For small-enrollment courses, this will limit the ability to examine some of the demographic metrics, but other metrics may still provide insights.
In some cases, an instructor may suspect that the difference in an assignment grade by a given demographic might be due to difference in rates of completion as opposed to difference in performance for those that completed the assignment.
For example, a disproportionate rate of zero scores for male students could result in a lower average grade for male students versus female students. The Performance Demographics dashboard has filter that allows an instructor to examine that mechanism. Changing “Missing Assignments” from “Include All Scores” to “Remove Zero Scores” only retains non-zero scores. If, as instructor zero scores represent non-completion, the instructor can see if differences remain when looking at just those students that completed the assignment. The information may change the planned intervention.
While Performance Demographics can sometimes assist instructors in sorting among different hypotheses about how demographic difference may be developing in a course, it is unlikely to suggest a solution per se.
There is a developing set of pedagogical strategies in the peer-reviewed literature on college teaching and learning which have been demonstrated to assist with demographic differences. The Performance Demographics dashboard can assist in understanding which particular demographic groups might benefit the most, especially if certain interventions are documented as better assisting a particular demographic. The dashboard can also assist instructors in monitoring the effectiveness of pedagogical changes and in a real-time manner during the semester.
For more information about Course Insights and any of its dashboards, contact Chad Brassil. For assistance addressing demographic differences seen in your course, contact an instructional designer assigned to your college.