CliGrow is a new agroclimate tool developed by the High Plains Regional Climate Center. It allows users to estimate crop maturity using growing degree days for any location in the lower 48 states. Estimates are available for ten different crops, with more arriving at a later date. The best part is that you can save the link to the graph and revisit your field’s up-to-date estimate at any time.
A YouTube video about CliGrow is available at https://www.youtube.com/watch?v=CMgsZRzhA24, or you can read our blog post at https://hprcc.unl.edu/blog/2023/05/30/cligrow-crop-maturity-app/
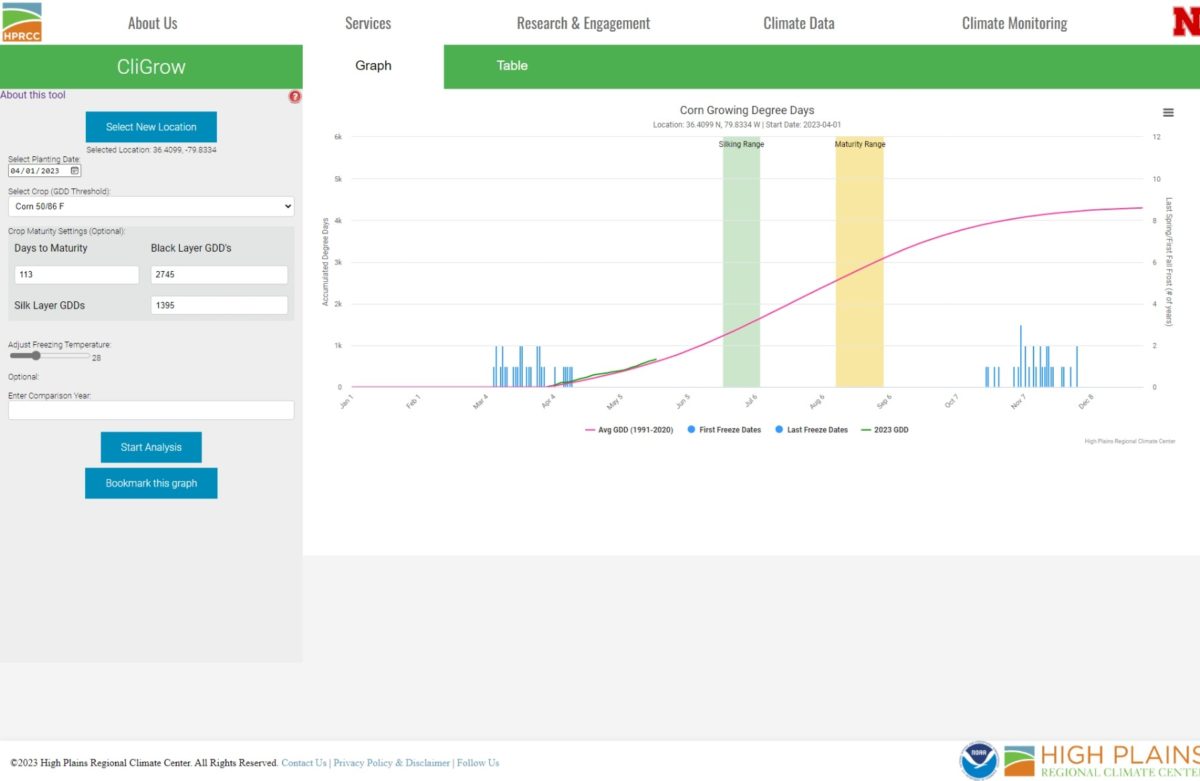
CliGrow is a Growing Degree Day (GDD) based crop maturity estimation tool for any location in the contiguous United States. View GDD accumulations for any year from 1991 to the current growing season, compare an accumulation to the 1991-2020 average, and view when and how often first and last freezes occur within a year. Using a GDD maturity value, view the range of dates when crops are estimated to have matured since 1991, and see an estimate of whether the current growing season has reached that point. CliGrow works for ten different crops, with more planned with future updates.
In this example, we are showing the GDD accumulation for corn at a location in rural North Carolina.
The blue bars are showing the frequency of first or last freezes based on the temperature you selected. In this case, we can see that the latest a 28 degree freeze has ever occurred was in April of 2016. Similarly, in October of 2015 this location experienced its earliest ever freeze.
The green line is showing the accumulation of Growing Degree Days starting on the planting date, and the pink line is showing the average accumulation based on data from 1991-2020. In this example, we can see that this field is estimated to be growing at a near average rate so far this year.
In the example graph, you can see two colored vertical bars. If you did not select corn, you probably see only one bar. If you left the Crop Maturity Settings blank, you won’t see any. Each vertical bar represents the range of dates when maturity has occurred, based on the Growing Degree Value provided in the Crop Maturity Settings. In the example image, the green bar is showing that the silk layer has been reached earliest on June 20, 1991, and latest on July 7, 1997. If the green line showing the current year’s accumulation has reached the maturity Growing Degree Day value, a solid vertical bar will appear at that point, representing the estimated maturity point for the planting year.
More details at: https://hprcc.unl.edu/agroclimate/cligrow/