The Course Insights Click Demographics dashboard in Canvas allows instructors to see how students are interacting with course components. This data helped Wendy Smith, director of the Center for Transformative Teaching, see which materials their students were engaging with the most and helped determine which digital content they remediated to be ADA Title II compliant.
What is the Click Demographics dashboard?
In Canvas Course Insights, click demographics let an instructor look at when and for how long students are clicking on various parts of a course in Canvas, such as pages, files, and assignments. You can look at what percentages of students clicked on a file or page at least once, the total number of clicks across the class, or the time spent viewing particular parts of the course. The viewing time metric stops counting if a student stops clicking anywhere for 10 minutes. This prevents artificially long viewing times if someone leaves a file or page open. There is also the option to look at clicking behavior by gender, ethnicity, first-generation status, course grade, and more.
Identify unused files delete.
Like many instructors, I use PDF files in my courses, with links to the files in Canvas. However, thanks to workshops by the CTT and accessibility training in Bridge, I have come to realize that these files can be some of the more difficult types to make accessible. For most of my files, accessibility changes have included using heading styles, adding alt text to images, and formatting tables differently or removing them. In a few cases, I was able to convert the PDF files to Word documents and then more easily add accessibility features. However, for some pdf files, that type of conversion doesn’t work well, particularly those with graphics. I realized I could look at the Click Demographics dashboard in Canvas (Canvas Course > Course Insights > Click Demographics) to see if students were even using those files.
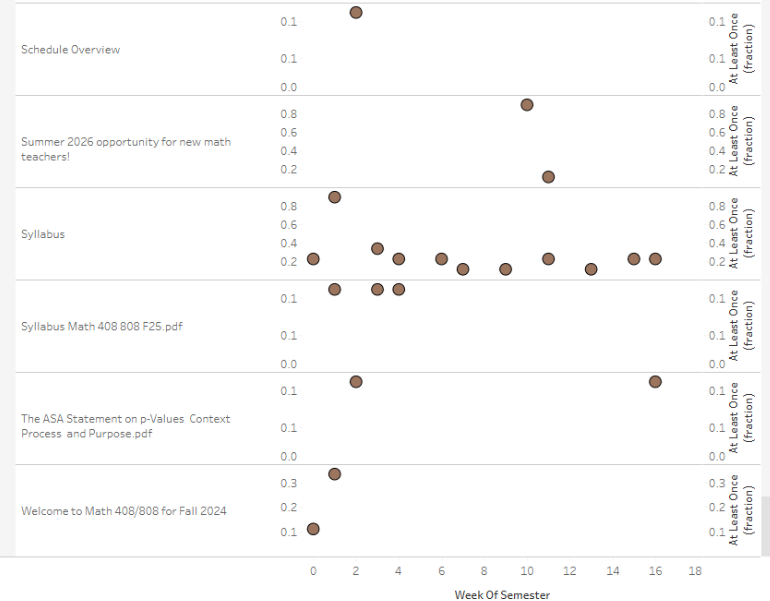
There are several filters across the top of the Click Demographics dashboard, including “cluster by.” I set the clusters to be “names” so I could see specific files, then sorted by Modules to match how my Canvas course is set up. I chose “at least once” for the click pattern to see if there were files that no one in the course was opening. I found three pdf files I had linked in Canvas were never clicked on by any student. So, I crossed those off my list for remediation and will not include them in the fall 2026 version of this course. I also found that only one student clicked on a pdf file I had generated for what I thought were useful resources for the course: another file crossed off my list.
Identify files to keep.
Conversely, I had the impression that students weren’t looking at my “semester wrap up” module and page but found in the click demographics that actually all the students clicked on that module at least once. So, this tells me that for the fall 2026 version of this course, I should keep this module and be sure I have it updated in terms of accessibility.
Nudge student engagement.
Early in the semester, it can be useful to look at the click demographics by student grades. If you see clear patterns, you can let the class know that the students with A and B averages in class are spending twice as long viewing assignments (as an example) as students who have a C average. Connecting effort and course engagement to outcomes like grades can nudge students to spend more time with course materials.
More details at: https://analytics.unl.edu/