Archived Story: This article is part of our newsletter archives. It has
been preserved for reference, but the information may no longer be current.
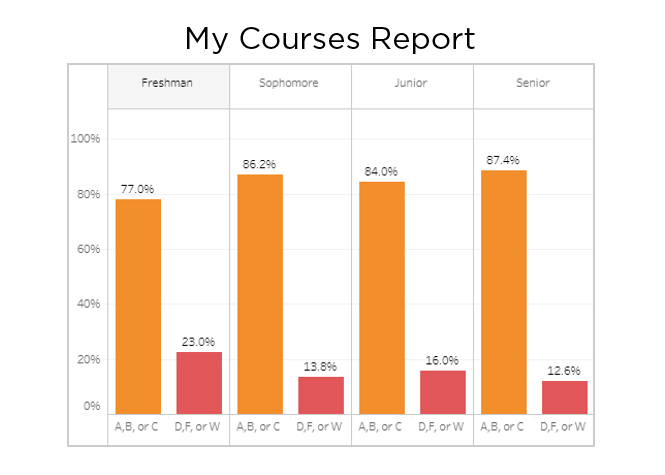
Institutional Effectiveness and Analytics, in collaboration with Executive Vice Chancellor's Office, has published an interactive Tableau report to help instructors review their enrollments and grade distributions by course and student demographic breakouts. This report is open to all university employees who are currently, or have in the past, been listed as an instructor on a course. For those familiar with using Tableau: the report can be found under the UNL – IEA project folder as “My Courses Report” or directly at go.unl.edu/MyCourses.
For those who have not used Tableau or need a refresher on how to log in, here a few reminders:
- University Network – In order to access Tableau, you must either be on campus using the university network or, if logging in from off campus, using the VPN network.
- NUinsight.Nebraska – the Tableau webpage is nuinsight.nebraska.edu
- TrueYou – The credentials you will need to log in are your NUID and TrueYou password.
- DUO – You will need to Duo authenticate to log in.
If you have questions about Tableau or issues logging in, navigating, or using the report, contact Ryan Caldwell at ryan.caldwell@unl.edu.
More details at: https://go.unl.edu/MyCourses