Canvas Learning Management System has released a new analytics tool for use as of October 2018. Referred to as Analytics 2, this tool provides more detailed, interactive features highlighting participation, submission timeliness, and grades. Both faculty and students have access to Analytics 2, though the student view is restricted at this time. Ideally, students and faculty can use this tool to better understand a student’s overall participation, progress, and academic performance within a specific course.
Analytics 2 can be accessed through the Canvas course’s homepage. Upon accessing it, faculty have the ability to filter or sort a variety of course average data according to their individual needs. Examples include examining submission types — assignments, discussion entries, or quizzes — and timeliness by class sections, as well as by individual assignments. Faculty can also view data for all students or within a more narrow scope of specific students only. The resulting data visualization can be displayed as a chart or data table depending upon the user’s preference.
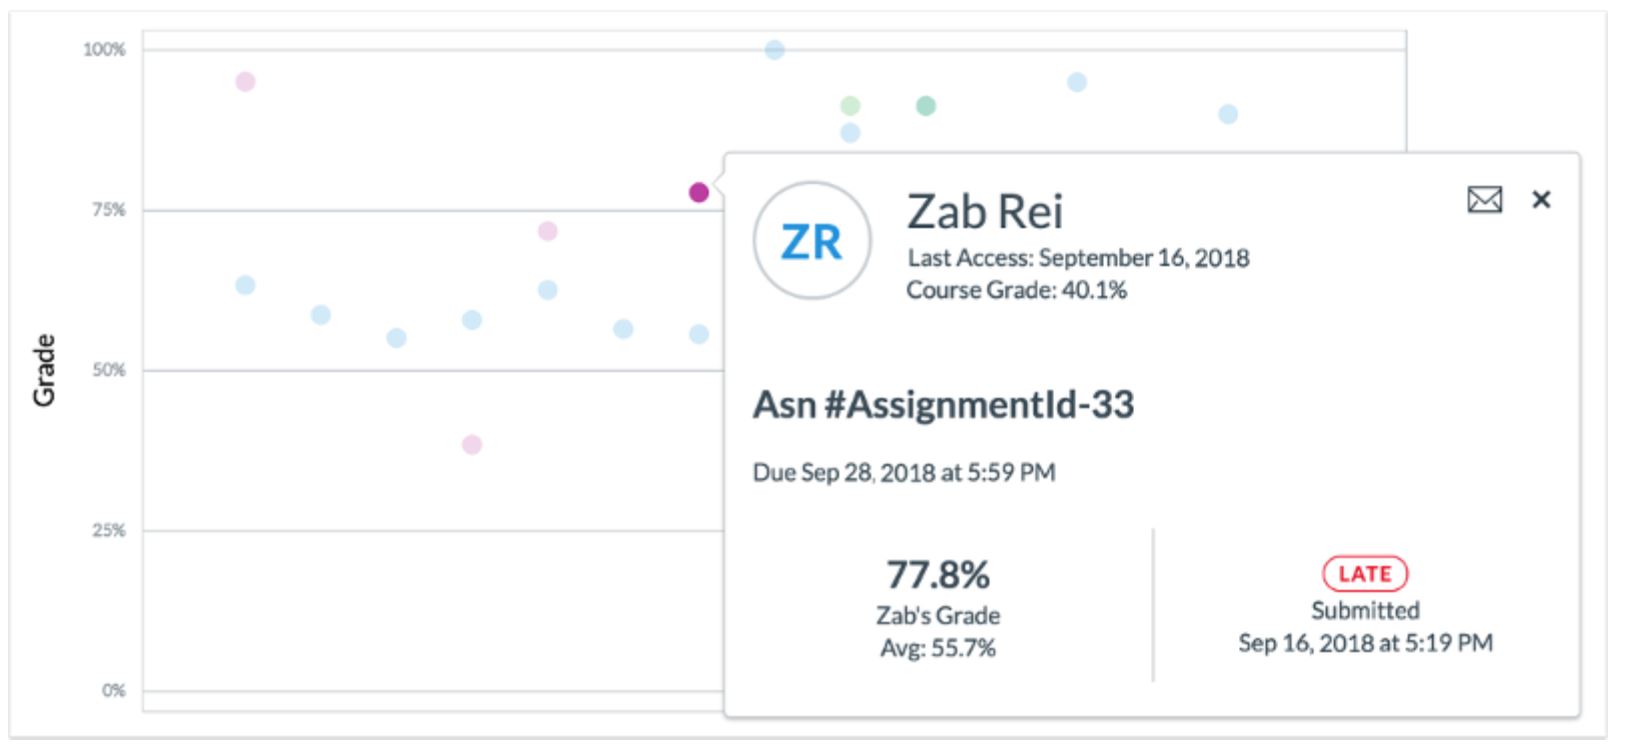
Additionally, Analytics 2 provides relevant messaging features that work in tandem with the data provided. When examining individual student data, faculty can message the student directly through Canvas. Likewise, students who meet criteria identified by the instructor — such as falling within a failing grade range on a specific assignment or within the course overall — can be mass emailed through the tool’s student roster feature. In this manner, Analytics 2 incorporates practical communications features to assist faculty teaching endeavors as they analyze their available course and student data.
In comparison to the available faculty features, the student view is limited to seeing one’s individual grades against the rest of the class. Through this visualization feature, students will be better equipped to identify potential course challenges and proactively seek out assistance sooner. At this time, however, only the faculty features are available with the student view deploying at a later date.
Analytics 2 provides a more robust level of interaction for faculty interested in their course data, ideally providing insights into their students’ progress, as well as performance from term to term. For more information regarding Canvas analytics or learning analytics in general, please contact Jessica Steffen at jsteffen@nebraska.edu.
More details at: https://go.unl.edu/g7yr